One of the largest microgrids in the United States, the UT Austin Carl J. Eckhardt Combined Heat and Power plant (CHP) is capable of generating 138 MW (megawatt) power (62 MW peak) and 1.2 million lb/hr (pounds per hour) of steam. The single largest electrical load on our main campus is the cooling system that can provide 60,600 tons (38,000 tons peak) of chilled water to the campus.
The power complex provides 100 percent of electricity and heating. Our five chilling stations and 9.5 million gallons of chilled water in two thermal energy storage tanks satisfy the cooling requirements for over 24 million square feet in more than 240 campus buildings, serving 79,000 faculty, students, and staff. The complex provides the university with an independent utility system, with electrical ties to the City of Austin electrical grid as an emergency backup source of power.
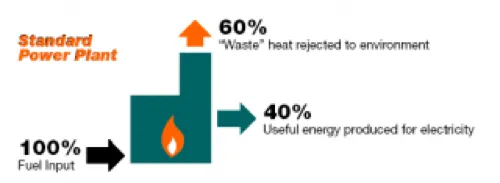
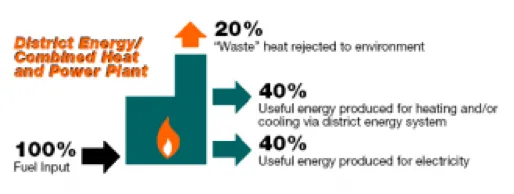
Operating as a CHP and district energy system, the university is able to function with much greater reliability and efficiency than that afforded through purchased energy. Typical power plants generate waste heat, which is not used for electricity production and is generally expelled either into the atmosphere through cooling towers or into local reservoirs. A CHP facility is able to convert this heat into useful work, such as space heating and hot water, thereby converting around 80 percent of the energy into useful work.
The diagram below provides a general outline of how the university’s CHP system operates.
Waste heat from the combustion turbine is recovered and output to a heat recovery steam generator. The recovered heat is then used to generate steam for power, heating, and hot water generation in campus buildings.
Energy Efficiency Comparison of Standard Power Plant versus Combined Heat & Power Plant
Reliability
The UT Austin electric grid has operated with 99.9998 percent reliability over the last 40 years. Based on a three-year average, the grid’s reliability score for outage duration (SAIDI) was 9.5 minutes and outage frequency (SAIFI) was 0.93. In contrast, the U.S. national average SAIDI is 440 minutes and the SAIFI is 1.43.
Energy Efficiency
In 1996, the power plant’s overall energy efficiency was 62 percent, compared to a typical power plant's energy efficiency of only 35 percent. Through 2008, the power plant efficiency increased to 72 percent due to plant modifications and the implementation of sophisticated optimization technologies. Chilled water production strategies and the installation of a new gas turbine, operational in 2010, have contributed to reduced fuel consumption and increased efficiency by up to 88 percent.
Emissions
Carbon dioxide (CO2) emissions have always been an area of concern with fossil fuel power plants, more recently with a growing awareness of a facility’s carbon footprint. While natural gas is considered one of the cleanest fossil fuels available, it is still a significant source of greenhouse gas emissions, notably carbon dioxide. Since 1996, the UT power plant has generated 6,300,000 tons of carbon dioxide, averaging about 233,000 tons per year. Figuratively, this is equivalent to the carbon output of 44,500 cars on the road in a year.
Our system has avoided releasing 1,252,119 metric tons of carbon dioxide (CO2e). That’s equivalent to taking 239,136 cars off the road for a year or preserving 8,771 acres of forest.--a forest roughly 22 times the size of the UT Austin main campus.
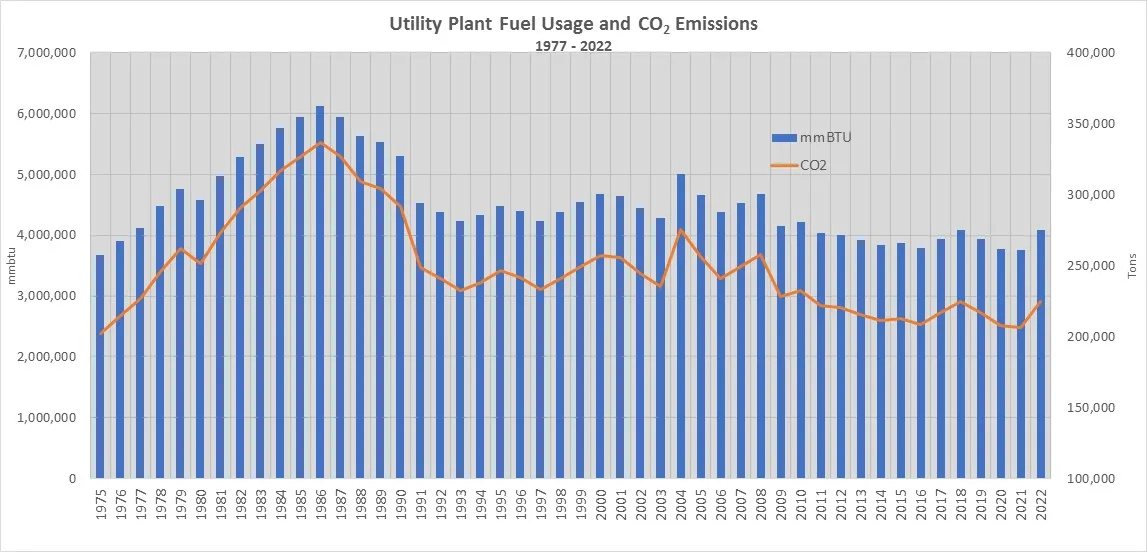
Carbon emissions today are equivalent to 1976 levels despite an increase in campus growth in terms of size and load.
The Carl J. Eckhardt Heating and Power Complex has enabled the UT Austin main campus to continue growing while actively reducing the environmental impact due to fuel and water consumption. As the campus grows, so, too, will the efficiency of the complex.
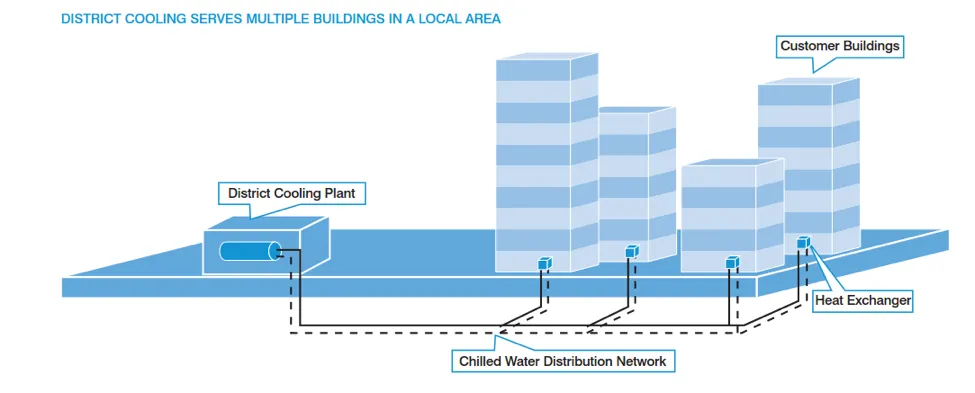
How Does UT’s District Cooling Work?
District cooling follows a simple process, illustrated below:
- Water is chilled to 40 F at each of our five central cooling plants, also known as chilling stations.
- Chilled water is pumped through a network of insulated pipes to campus buildings.
- Chilled water is circulated throughout the buildings to cooling coils in air handlers.
- Air is then blown across the cooling coils of the air handing systems, producing cold air.
- The water is returned to the chilling stations to be cooled again and reused.
Components of the district cooling system include:
- Central cooling plants
- Chilled water distribution piping system
- Heat exchangers in the campus buildings
Benefits of District Cooling
- District cooling is 40 to 50 percent more energy efficient than conventional systems.
- It has substantially lower operating costs, higher operating reliability and availability.
- It reduces new building construction costs compared to conventional air-conditioning systems.
- District cooling improves air quality and temperature control. These are frequently difficult to monitor and regulate, especially if the system is operating below optimal levels.
- District cooling offers a high potential for economies of scale through the use of large centralized plants to replace multiple individual units.
- District cooling reduces net CO2 emissions compared to distributed conventional systems.
UT Austin’s District Cooling System
The university’s district cooling system consists of five cooling plants distributed strategically across campus and interconnected by more than eight miles of piping. With the addition of our latest plant, designed to serve the Dell Seton Medical Center, our stations have a combined capacity of 60,600 tons of cooling and are complemented by two thermal energy storage tanks which store a combined 9.5 million gallons of chilled water.
Our stations use a variety of advanced technologies to minimize the cost of cooling the campus:
- Variable speed motors – The ability to run chiller compressors, pumps, and fan motors at variable speeds, rather than modulating output by throttling valves, allows us to achieve greater efficiencies.
- Real time optimization – To fully exploit the advantages of variable speed equipment, a control system monitors campus chilled water conditions every two seconds and uses advanced algorithms to minimize compressor, pumping, and fan motor energy continuously.
- Hydraulic modeling – A network of instruments distributed across campus provides a real-time view of the system. The model takes as inputs weather conditions, real-time building energy flows, plant chilled-water flow, and differential-pressure (dP) readings from critical points in the system to predict and validate conditions throughout the network, including flow-constraint locations.
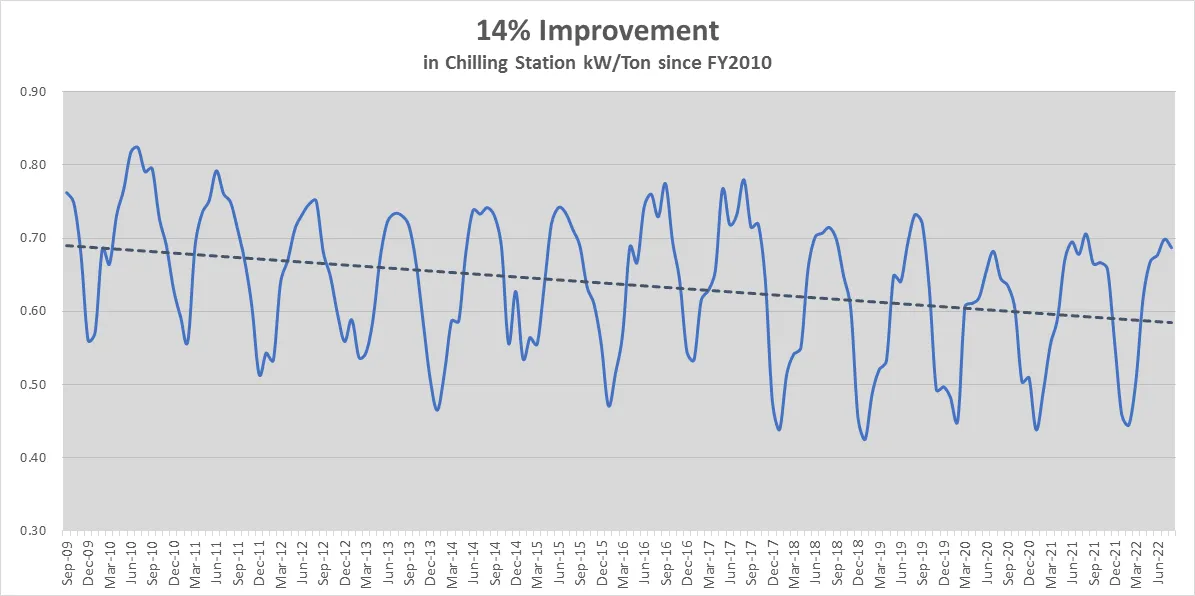
The overall goal of system optimization is to use the least amount of electricity to produce chilled water. Our optimization strategies have steadily decreased the number of kilowatts required to produce a ton of cooling.